HEAVI - HawkEye Aggregated Volume IndicatorThis is combined Aggregated BTC Exchange Volume by Neobutane with HawkEye volume clone indicator by LazyBear.
Indicator includes aggregated raw BTC volume from 9 user selectable fiat and tether exchanges + Exponential MA + hawkeye bar coloring where: green is bullish volume, red - bearish and white - volume neutral to the market:
Bitfinex
Coinbase
Bitstamp
Kraken
Binance
Poloniex
Bittrex
bitFlyer
Bithumb
Search in scripts for "volume indicator"

Volume+ by BDthis is a simple volume indicator,
shows volume sizes with color differences on histogram (total volume, neutral volume and effective volume)
bar length = total volume, gray bar= neutral volume, green bar= pozitive volume, red bar= negative volume
variable value; The bar's average will be calculated until the given value. by default is average not calculated
VolumeS as stochThis volume indicator is my design. in this example we can use it as stoch but only this one based on pure volume .
since it a volume and not price based it allow us to see the real trend before the price go up or down. And by simple math of conversion volume number to real number . we can add this indicator to any indicator that we choose and we can enhance it affect.
this is just concept idea. as the real best setting for this need still to be found:)
if you want o make it faster or slower just change the smooth or length setting
so have fun

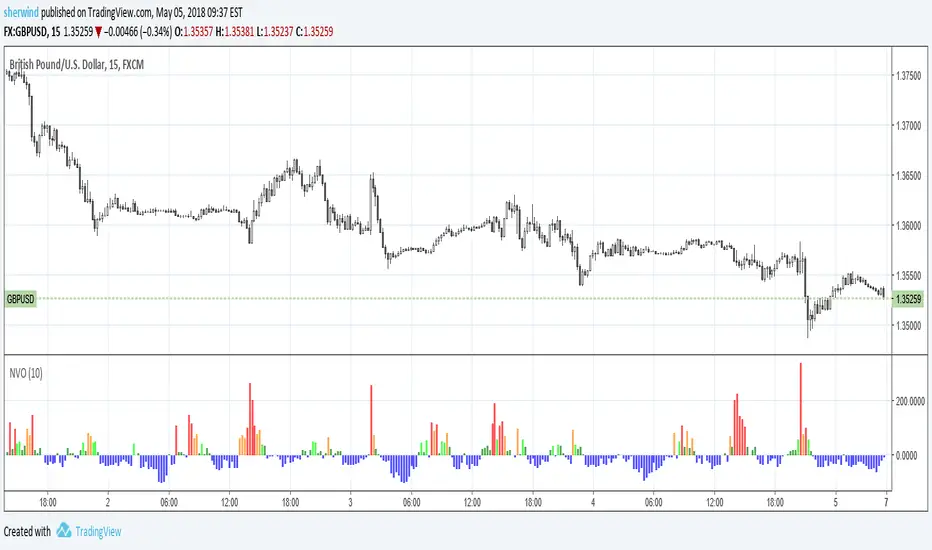
Normalized Volume OscillatorThis volume indicator works best on comparatively small timeframes (15 minutes, for example).
Based on:
- Normalized Volume Oscillator - indicator for MetaTrader 4
- Using Tick Volume in Forex: A Clear NVO Based Example
See also:
- Are price updates a good proxy for actual traded volume in FX?
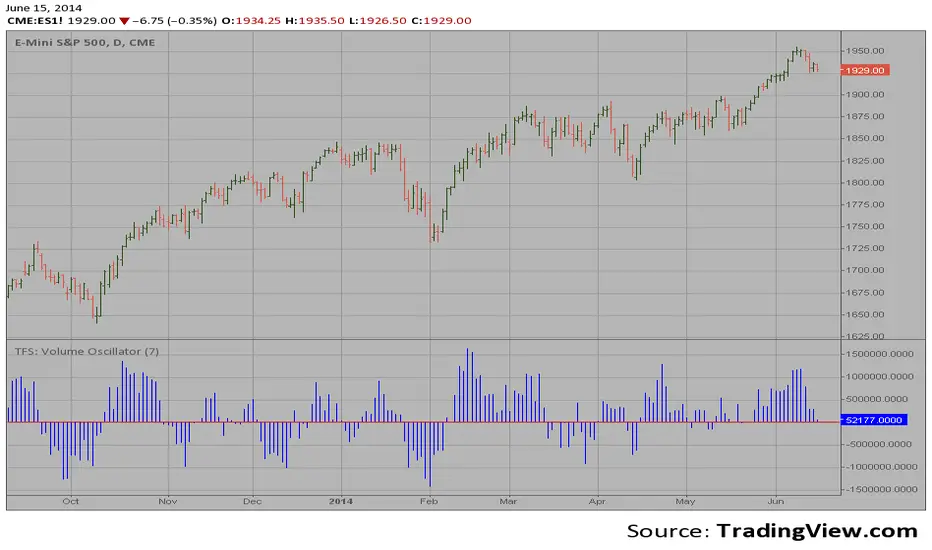
TFS: Volume Oscillator Backtest This is the second part of TFS trading strategy. The concept of this
indicator is similar to that of On-Balance Volume indicator (OBV). It
is calculated according to these rules:
If Close > Open, Volume is positive
If Close < Open, Volume is negative
If Close = Open, Volume is neutral
Then you take the 7-day MA of the results.
You can change long to short in the Input Settings
WARNING:
- For purpose educate only
- This script to change bars colors.

TFS: Volume Oscillator Strategy This is the second part of TFS trading strategy. The concept of this
indicator is similar to that of On-Balance Volume indicator (OBV). It
is calculated according to these rules:
If Close > Open, Volume is positive
If Close < Open, Volume is negative
If Close = Open, Volume is neutral
Then you take the 7-day MA of the results.
WARNING:
- This script to change bars colors.

1337 VolumeThis volume indicator gives you a unique perspective and ability to analyze volume in any market. The upper line that is always >=0 represents average up volume over a user definable period while the lower line that is always <= 0 represents the average down volume over a user definable period.
green == bullish candle but volume lower than average
lime == bullish candle with above average volume
crimson == bearish candle with below average volume
red == bearish candle with above average volume
This indicator is very useful for spotting bottoms / tops (do a visual backtest and observe its behavior) as well as entry opportunities.
By default, the lookback period for average volume is 7, but I encourage you to change this value in order to find settings that work best for your particular market.
If you have any feedback or ideas for improvement, please comment.
Enjoy :D
TFS: Volume Oscillator This is the second part of TFS trading strategy. The concept of this
indicator is similar to that of On-Balance Volume indicator (OBV). It
is calculated according to these rules:
If Close > Open, Volume is positive
If Close < Open, Volume is negative
If Close = Open, Volume is neutral
Then you take the 7-day MA of the results.
Normalized Volume by MQNupe3This script adds a volume indicator that's normalized by SMA (10) by default. This will help you easily see whether the volume is actually high or not. It also highlights through volume is exceeding the average by making them column a brighter color.
This script was derived from Tradingview user: Vosechu . The original script came from the following: Normalized Volume by Vosechu. I just tweaked ths script so the volume bars do not float and I flipped the colors. He did all the hard work.

On Balance Volume (with Candles)OBV+ is an enhanced On Balance Volume indicator that visualizes volume flow either as a line or candlestick-style OBV bars. It shows whether volume is accumulating or distributing, and includes optional moving-average smoothing and Bollinger Bands on OBV to identify trend direction, consolidation, and breakout strength.
Use-Cases
This indicator is especially useful for:
Bullish setup:
Price sideways + OBV rising → accumulation
Bearish setup:
Price rising + OBV flat/falling → distribution
Breakout confirmation:
Price breakout + OBV breaking BB → high conviction move
Options selling filter:
Flat OBV + compressed BB → range-bound market

WOLFGATEWOLFGATE is a clean, session-aware market structure and regime framework designed to help traders contextualize price action using widely accepted institutional references. The indicator focuses on structure, momentum alignment, and mean interaction, without generating trade signals or predictions.
This script is built for clarity and decision support. It provides a consistent way to evaluate market conditions across different environments while remaining flexible to individual trading styles.
What This Indicator Displays
Momentum & Structure Averages
9 EMA — Short-term momentum driver
21 EMA — Structural control and trend confirmation
200 SMA — Primary regime boundary
400 SMA (optional) — Deep regime / macro bias reference
These averages are intended to help assess directional alignment, trend strength, and structural consistency.
Session VWAP (Institutional Mean)
Session-based VWAP with a clean daily reset
Default session: 09:30–16:00 ET
Uses HLC3 as the VWAP source for balanced price input
Rendered in a high-contrast institutional blue for visibility
VWAP can be used to evaluate mean interaction, acceptance, or rejection during the active session.
How to Use WOLFGATE
This framework is designed for context, not signals.
Traders may use WOLFGATE to:
Identify bullish or bearish market regimes
Evaluate momentum alignment across multiple time horizons
Observe price behavior relative to VWAP
Maintain directional bias during trending conditions
Avoid low-quality conditions when structure is misaligned
The indicator does not generate buy or sell signals and does not include alerts or automated execution logic.
Important Notes
Volume must be added separately using TradingView’s built-in Volume indicator
(Volume cannot be embedded directly into this script due to platform limitations.)
This script is intended for educational and analytical purposes only
No financial advice is provided
Users are responsible for their own risk management and trade decisions

DANCE WITH WOLVES VN ALL TO 1DANCE WITH WOLVES VN is a smart-money volume indicator designed for stocks and crypto.
Main features:
• logic to detect Distribution, No Demand, Absorption and Exhaustion.
• Automatically builds smart Support/Resistance zones from high-volume price leaders.
• Regression trend channel to see the short-term trend and trading range.
• Dashboard table that shows the top high/low price bars with buy/sell volume and group labels.
• Alert conditions for Breakout above resistance and At Support Area so you don’t need to watch the chart all the time.
You can use it on any symbol and timeframe. Just add the script to your chart and follow the zones (red = resistance, green = support) together with the P/L labels and the status line.
Smart Money Volume + Support/Resistance + Trend Channel.
Tự động vẽ vùng hỗ trợ/kháng cự theo volume mạnh/yếu, label (Distribution, No Demand, Absorption, Exhaustion) và kênh xu hướng.
Cách dùng:
Uptrend: ưu tiên mua ở gần cạnh dưới kênh hoặc vùng hỗ trợ.
Downtrend: ưu tiên bán/short ở gần cạnh trên kênh hoặc vùng kháng cự.
Sideway: đánh range – mua gần support, bán gần resistance, cẩn thận false break.
P… = vùng giá cao → nhìn kiếm setup chốt lời / short / tránh FOMO.
L… = vùng giá thấp → nhìn kiếm setup bắt nhịp hồi / entry buy an toàn hơn.

DANCE WITH WOLVES VN ALL TO 1DANCE WITH WOLVES VN is a smart-money volume indicator designed for stocks and crypto.
Main features:
• logic to detect Distribution, No Demand, Absorption and Exhaustion.
• Automatically builds smart Support/Resistance zones from high-volume price leaders.
• Regression trend channel to see the short-term trend and trading range.
• Dashboard table that shows the top high/low price bars with buy/sell volume and group labels.
• Alert conditions for Breakout above resistance and At Support Area so you don’t need to watch the chart all the time.
You can use it on any symbol and timeframe. Just add the script to your chart and follow the zones (red = resistance, green = support) together with the P/L labels and the status line.
Vietnamese note: Indicator dùng volume + để vẽ vùng hỗ trợ/kháng cự thông minh, label phân phối / hấp thụ / cạn lực bán và kênh xu hướng. Dùng được cho cả stock và crypto. tot nhat dung khung 5 den 15 phut

20/50/200 EMA with RVOL Filter Hariss 369Understanding to trade with this indicator is very simple. 20 EMA acts as dynamic support and resistance. 50 EMA is best for intraday/short term trend filter and 200 EMA is best for long term trend filter. One should always trade with the trend. Combination of all threes entails safe trading with trend. Undoubtedly, volume plays vital role to move the price up or down. The volume indicator used here is Relative Volume (RVOL) rather simple volume. 1.5 RVOL is considered as strong trend to trade considering other factors intact. You can tick/untick RVOL and you can also change the level of RVOL from input section.
You can also change the color of EMAs and pattern of buy and sell signal. Place this indicator over the chart. You can choose any type of asset and any time frame.
Though buy and sell signals are there. The concept of trading is buy when price closes above 20 ema and 20 ema >50ema>200 ema. Place stop loss below the low of last candle or just below 20 ema. Target 1.5/2 times of stop loss. You can also trail it with 20 ema or 50 ema depending upon your trading style and risk appetite. You can also take positional trade, in that case 200 ema to be considered as stop loss. Sell when price closes below 20 ema, 20 ema<50ema<200 ema. For intraday trading, 20 ema is best to enter and exit. Taking RVOL into consideration is best way in order to trade with high liquidity-safer way to entry and exit.

Advanced Volume indicator This indicator shows 4H volume on the 1H chart.
I am using this one for my swing trade system on the 1H chart, which I will also publish later.
My entry signal is a extraordinary volume candle, a red threshold line can mark “very high volume” zones (SMA × multiplier).

Standardization (Z-score)Standardization, often referred to as Z-score normalization, is a data preprocessing technique that rescales data to have a mean of 0 and a standard deviation of 1. The resulting values, known as Z-scores, indicate how many standard deviations an individual data point is from the mean of the dataset (or a rolling sample of it).
This indicator calculates and plots the Z-score for a given input series over a specified lookback period. It is a fundamental tool for statistical analysis, outlier detection, and preparing data for certain machine learning algorithms.
## Core Concepts
* **Standardization:** The process of transforming data to fit a standard normal distribution (or more generally, to have a mean of 0 and standard deviation of 1).
* **Z-score (Standard Score):** A dimensionless quantity that represents the number of standard deviations by which a data point deviates from the mean of its sample.
The formula for a Z-score is:
`Z = (x - μ) / σ`
Where:
* `x` is the individual data point (e.g., current value of the source series).
* `μ` (mu) is the mean of the sample (calculated over the lookback period).
* `σ` (sigma) is the standard deviation of the sample (calculated over the lookback period).
* **Mean (μ):** The average value of the data points in the sample.
* **Standard Deviation (σ):** A measure of the amount of variation or dispersion of a set of values. A low standard deviation indicates that the values tend to be close to the mean, while a high standard deviation indicates that the values are spread out over a wider range.
## Common Settings and Parameters
| Parameter | Type | Default | Function | When to Adjust |
| :-------------- | :----------- | :------ | :------------------------------------------------------------------------------------------------------ | :-------------------------------------------------------------------------------------------------------------------------------------------------------------------------- |
| Source | series float | close | The input data series (e.g., price, volume, indicator values). | Choose the series you want to standardize. |
| Lookback Period | int | 20 | The number of bars (sample size) used for calculating the mean (μ) and standard deviation (σ). Min 2. | A larger period provides more stable estimates of μ and σ but will be less responsive to recent changes. A shorter period is more reactive. `minval` is 2 because `ta.stdev` requires it. |
**Pro Tip:** Z-scores are excellent for identifying anomalies or extreme values. For instance, applying Standardization to trading volume can help quickly spot days with unusually high or low activity relative to the recent norm (e.g., Z-score > 2 or < -2).
## Calculation and Mathematical Foundation
The Z-score is calculated for each bar as follows, using a rolling window defined by the `Lookback Period`:
1. **Calculate Mean (μ):** The simple moving average (`ta.sma`) of the `Source` data over the specified `Lookback Period` is calculated. This serves as the sample mean `μ`.
`μ = ta.sma(Source, Lookback Period)`
2. **Calculate Standard Deviation (σ):** The standard deviation (`ta.stdev`) of the `Source` data over the same `Lookback Period` is calculated. This serves as the sample standard deviation `σ`.
`σ = ta.stdev(Source, Lookback Period)`
3. **Calculate Z-score:**
* If `σ > 0`: The Z-score is calculated using the formula:
`Z = (Current Source Value - μ) / σ`
* If `σ = 0`: This implies all values in the lookback window are identical (and equal to the mean). In this case, the Z-score is defined as 0, as the current source value is also equal to the mean.
* If `σ` is `na` (e.g., insufficient data in the lookback period), the Z-score is `na`.
> 🔍 **Technical Note:**
> * The `Lookback Period` must be at least 2 for `ta.stdev` to compute a valid standard deviation.
> * The Z-score calculation uses the sample mean and sample standard deviation from the rolling lookback window.
## Interpreting the Z-score
* **Magnitude and Sign:**
* A Z-score of **0** means the data point is identical to the sample mean.
* A **positive Z-score** indicates the data point is above the sample mean. For example, Z = 1 means the point is 1 standard deviation above the mean.
* A **negative Z-score** indicates the data point is below the sample mean. For example, Z = -1 means the point is 1 standard deviation below the mean.
* **Typical Range:** For data that is approximately normally distributed (bell-shaped curve):
* About 68% of Z-scores fall between -1 and +1.
* About 95% of Z-scores fall between -2 and +2.
* About 99.7% of Z-scores fall between -3 and +3.
* **Outlier Detection:** Z-scores significantly outside the -2 to +2 range, and especially outside -3 to +3, are often considered outliers or extreme values relative to the recent historical data in the lookback window.
* **Volatility Indication:** When applied to price, large absolute Z-scores can indicate moments of high volatility or significant deviation from the recent price trend.
The indicator plots horizontal lines at ±1, ±2, and ±3 standard deviations to help visualize these common thresholds.
## Common Applications
1. **Outlier Detection:** Identifying data points that are unusual or extreme compared to the rest of the sample. This is a primary use in financial markets for spotting abnormal price moves, volume spikes, etc.
2. **Comparative Analysis:** Allows for comparison of scores from different distributions that might have different means and standard deviations. For example, comparing the Z-score of returns for two different assets.
3. **Feature Scaling in Machine Learning:** Standardizing features to have a mean of 0 and standard deviation of 1 is a common preprocessing step for many machine learning algorithms (e.g., SVMs, logistic regression, neural networks) to improve performance and convergence.
4. **Creating Normalized Oscillators:** The Z-score itself can be used as a bounded (though not strictly between -1 and +1) oscillator, indicating how far the current price has deviated from its moving average in terms of standard deviations.
5. **Statistical Process Control:** Used in quality control charts to monitor if a process is within expected statistical limits.
## Limitations and Considerations
* **Assumption of Normality for Probabilistic Interpretation:** While Z-scores can always be calculated, the probabilistic interpretations (e.g., "68% of data within ±1σ") strictly apply to normally distributed data. Financial data is often not perfectly normal (e.g., it can have fat tails).
* **Sensitivity of Mean and Standard Deviation to Outliers:** The sample mean (μ) and standard deviation (σ) used in the Z-score calculation can themselves be influenced by extreme outliers within the lookback period. This can sometimes mask or exaggerate the Z-score of other points.
* **Choice of Lookback Period:** The Z-score is highly dependent on the `Lookback Period`. A short period makes it very sensitive to recent fluctuations, while a long period makes it smoother and less responsive. The appropriate period depends on the analytical goal.
* **Stationarity:** For time series data, Z-scores are calculated based on a rolling window. This implicitly assumes some level of local stationarity (i.e., the mean and standard deviation are relatively stable within the window).

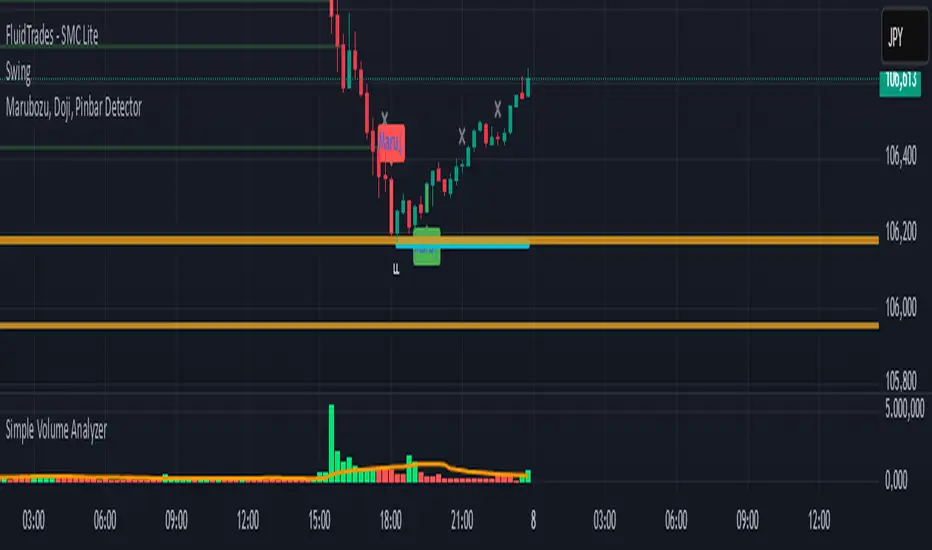
Simple Volume Analyzer..This is a simple yet powerful volume indicator that colors volume bars based on whether they are above or below a moving average. Useful for identifying breakouts and low-volume zones.
High Tick Volume Alert (Classic Style)This indicator has the classic appearance of the volume indicator for tick volume. It notifies you according to your individual settings when there is increased volume on price.

HOG Liquidity HunterHOG Liquidity Hunter – Pivot‑Based Liquidity Zones
📌 Overview
Plots dynamic support and resistance zones on swing pivots with an ATR‑based buffer. Anchored only when pivots are confirmed, the zones stay close to current price levels—ideal for spotting liquidity runs or traps.
🔧 How It Works
Detects swing highs and lows using ta.pivothigh() / ta.pivotlow() with a user‑defined lookback.
After a pivot is confirmed, calculates BSL/SSL zone = pivot ± (ATR * margin).
Zones update only on confirmed pivots—no repainting on open bars.
⚙️ Inputs
Lookback: bars to confirm pivots (e.g. 10–20).
ATR Margin Multiplier: buffer width (e.g. 1.25).
✅ Benefits
Structure‑focused: Zones align with real swing points.
Responsive yet stable: Tight ATR margin keeps zones precise, only updating on valid pivots.
Clean visuals: Two uncluttered zones—easy to interpret.
🛠 How to Use
Detect near‑zone bounce entries or exits on 4H/1D charts.
Combine with trend or volume indicators for stronger setups.
Use zones to identify potential stop‑run, liquidity re‑tests, or range turns.
⚠️ Notes & Disclaimers
Zones base off historical pivots; may lag until confirmed.
No future-looking data—relying entirely on closing bar confirmation.
Use alongside a complete trading framework; this is not a standalone signal.

On Balance VolumeThe traditional OBV (On-Balance Volume) indicator line chart has been replaced with a candlestick-based OBV chart, offering a more granular and visually comprehensive approach to volume-price analysis. This transformation allows traders to analyze OBV fluctuations in the form of candlestick patterns, making it easier to identify critical price action signals such as support and resistance levels, breakouts, and breakdowns.
By integrating OBV candlesticks with the price chart, traders can better assess volume accumulation and distribution phases, detect divergences, and confirm trend strength. This enhanced visualization helps in identifying momentum shifts, liquidity imbalances, and institutional activity with greater accuracy. The OBV candlestick chart provides a deeper layer of market structure analysis, allowing price action traders to refine their strategies and improve trade execution based on real-time volume dynamics."

Modified Volume IndicatorThis indicator colors volume bars based on price and range conditions for a given period:
Green Bars:
The close is at least 70% of the way up the daily range (from the low).
The close is also 1% or more above the low.
Red Bars:
The close is at least 70% of the way down the daily range (from the high).
The close is also 1% or more below the high.
Gray Bars:
Volume bars that don’t meet the above conditions are neutral.
Purpose
Green Bars highlight strong upward closes.
Red Bars indicate weak downward closes.
Gray Bars show neutral or inconclusive price movement.
This indicator helps traders identify momentum shifts and trend strength in real-time.
Combined Multi-Timeframe EMA OscillatorThis script aims to visualize the strength of bullish or bearish trends by utilizing a mix of 200 EMA across multiple timeframes. I've observed that when the multi-timeframe 200 EMA ribbon is aligned and expanding, the uptrend usually lasts longer and is safer to enter at a pullback for trend continuation. Similarly, when the bands are expanding in reverse order, the downtrend holds longer, making it easier to sell the pullbacks.
In this script, I apply a purely empirical and experimental method: a) Ranking the position of each of the above EMAs and turning it into an oscillator. b) Taking each 200 EMA on separate timeframes, turning it into a stochastic-like oscillator, and then averaging them to compute an overall stochastic.
To filter a bullish signal, I use the bullish crossover between these two aggregated oscillators (default: yellow and blue on the chart) which also plots a green shadow area on the screen and I look for buy opportunities/ ignore sell opportunities while this signal is bullish. Similarly, a bearish crossover gives us a bearish signal which also plots a red shadow area on the screen and I only look for sell opportunities/ ignore any buy opportunities while this signal is bearish.
Note that directly buying the signal as it prints can lead to suboptimal entries. The idea behind the above is that these crossovers point on average to a stronger trend; however, a trade should be initiated on the pullbacks with confirmation from momentum and volume indicators and in confluence with key areas of support and resistance and risk management should be used in order to protect your position.
Disclaimer: This script does not constitute certified financial advice, the current work is purely experimental, use at your own discretion.

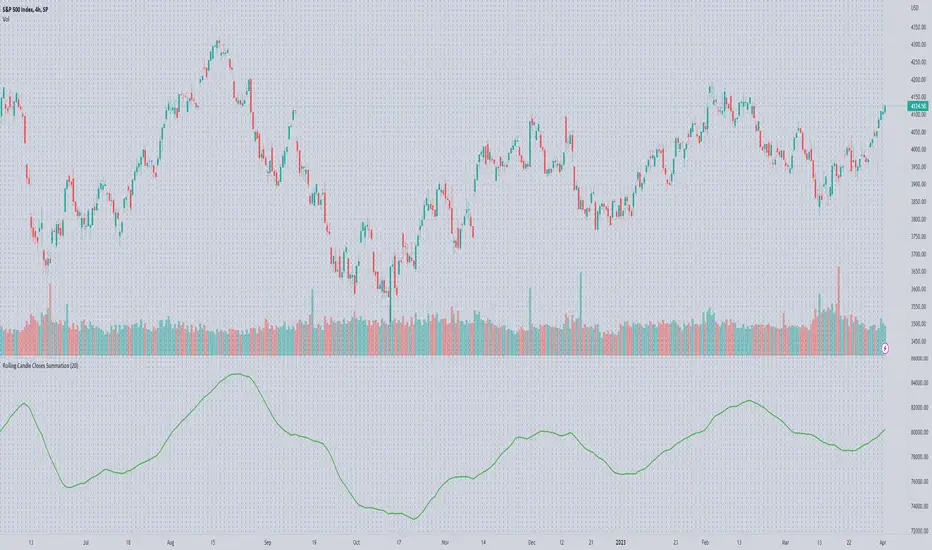
Rolling Candle Closes Summationscript to sum rolling 20 (default) period's prices together
use on volume indicators to get the likes of McClellan Summation
User selection: rolling periods to add